
Financial Modeling Tip – The Pyramid Principle
Financial modeling spreadsheets can quickly become unwieldy when analyzing complex business problems or dealing with large amounts of underlying data. In this article we share a structured approach for designing Excel models that has proven to be quite useful over the years – we call it the “Pyramid Principle[1].”
The Pyramid Principle – What is it?
Simply put, the Pyramid Principle is a way to structure your Excel workbook to optimize clarity, transparency and usability for various users and stakeholders. It allows them to quickly find the information they need and delve into more depth if needed. The workbook is a self-contained body of work that caters to the diverse requirements of different users.
We think of the worksheets in the model as falling into four distinct categories, as shown below, each typically with a different primary audience.
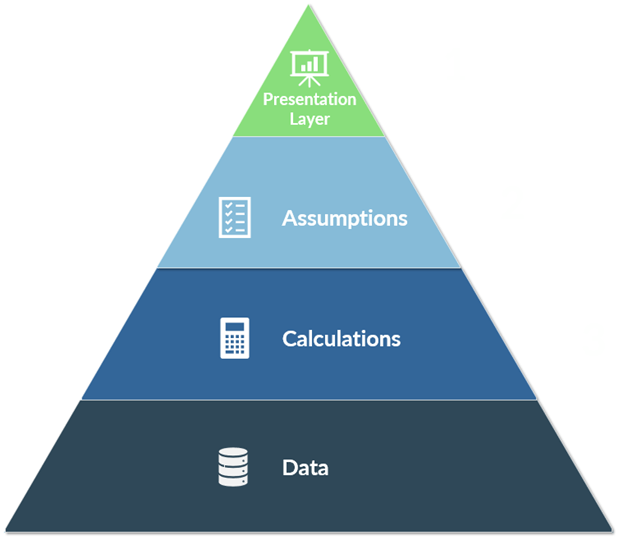
1. Presentation Layer: This is the end result (aka the “so what?”) of the analysis. Typical users of these sheets are senior leaders and decision-makers, who are more interested in the high-level conclusions and most critical assumptions, rather than excessive detail. This layer usually takes the form of an executive summary, dashboard, and/or highly-polished graphs and summary tables. They are intended to surface the key results and conclusions from the analysis, often in a presentation-friendly manner that can be easily incorporated into a slide deck or decision document.
2. Assumptions: This is where we house the assumptions and input variables for the model. Best practice is, wherever possible, to have all model drivers on one input sheet, and to include the ability to run multiple scenarios/perform sensitivity analysis. This layer of the pyramid is frequented by finance or business unit managers who want greater awareness of the assumptions and perhaps also may wish to run their own scenarios. These are often the individuals that are presenting the model to senior leadership and decision makers. We find that having a transparent and centralized record of the assumptions helps prepare them for these discussions.
3. Calculations: The beautiful math that spreadsheets are so good at! This is where all of the calculations occur and, depending on the complexity of your analysis, may end up being the bulk of the model spanning multiple worksheets. Users here may include finance and business unit managers again, and often extends to their direct reports to provide additional comfort/validation on the calculations and logic. On these sheets we tend to make judicious use of check total formulas with conditional formatting to help ensure the accuracy and completeness of the formulas and calculations.
4. Data: Any underlying data used in the calculations and analysis is stored on these sheets. The specific content will vary wildly depending on the type of analysis being conducted, but could include historical transaction data, forecast detail, and external economic data, etc. Our strong preference is to house the data within the model itself rather than linking to external files. This supports the principle of the model being a self-contained body of work, enhances transparency from the final executive summary straight through to the underlying data, and improves reliability (as external files are sometimes moved or renamed, breaking the links to them). Users here are most often analysts/junior manager stakeholders who are closest to the data and in the best position to provide it, or validate its accuracy/appropriateness for the project.
Closing Thoughts
By adhering to the Pyramid Principle, you can create a powerful AND user-friendly financial model, enabling your organization to make well-informed decisions. Moreover, this approach greatly enhances transparency and reduces the risk of errors, which is especially critical for more complex models.
If you’ve found value exploring the Pyramid Principle, we hope that you’ll share this article with two friends, and that each of them will share it with two friends and, well, you know…
[1] This draws on similar ideas put forth in the Minto Pyramid for written business communications, coined by former McKinsey consultant, Barbara Minto. If this article resonates with you and you’re also a frequent business writer, we recommend checking it out.
